Zabbix
Maintainer
[1]Daniel B. from Firewall Services
Description
Zabbix offers advanced monitoring, alerting and visualisation features today which are missing in other monitoring systems, even some of the best commercial ones:
Features
Here are some of the features provided by Zabbix:
- Distributed monitoring
- Centralized configuration
- Centralized access to all data
- Up-to 1000 of nodes
- Unlimited number of proxies
- Scalability
- Tested with 10,000 monitored devices and servers
- Tested with 100,000 availability and performance checks
- Processing of thousands of availability and performance checks per second
- Real-time monitoring
- Performance monitoring
- Availability monitoring
- Integrity monitoring
- Flexible notification conditions
- Alerting users (Email, SMS, Jabber)
- Logging
- Visualisation
- User-defined views and slide shows
- Mapping
- Graphing (including pie charts)
- Zooming
- Fast Problem Resolution
- Send alerts via email, cell phone, SMS or audio alerts
- Execute remote commands
- Assuring SLA
- Hierarchical IT Services
- Real-time SLA reporting
- Reporting and trending
- Easy integration of 3rd party tools
- Analysis of yearly/monthly/daily statistics
- SLA reports
- XML data import/export
- Easy sharing of templates
- Auto discovery
- Discovery by IP range, services and SNMP
- Automatic monitoring of discovered devices
- WEB monitoring
- WEB performance and availability monitoring
- Flexible scenarios
- Support of POST and GET methods
- Flexibility
- Support of IPv4 and IPv6
- Easily extendable native agents
- Any notifications methods
- Runs on any platform
- Pro-active monitoring
- Automatic execution of remote commands
- Automatic IPMI commands
- Aggregate monitoring
- Monitoring of a group of hosts as a single host
- Agentless monitoring
- Monitoring of remote services (FTP, SSH, HTTP, other)
- Support of SNMP v1,2,3
- Support of IPMI
- SNMP traps
- High performance agents
- All platforms supported (UNIX, Windows, Novell)
- Memory utilisation
- Network utilisation
- Disk I/O
- Disk space availability
- File checksums
- Monitoring of log files
- And more...
- Security
- Flexible user permissions
- Authentication by IP address
- Protection against brute force attacks
- Escalations and notifications
- Repeated notifications
- Unlimited escalations
- Recovery messages
- Be notified while problem is not resolved
- Management functions
- Ping, traceroute to a host
- Any other functions
- Dashboard
- Personalized dashboard
- Favourite resources
- High level view
- Agent-based monitoring
- Native agent for any platform
- Immune to connection problems
- Open Source Solution
- No license driven limitations
- Access to source code
- Open to code audit
- Easy Administration
- Very fast learning curve
- All data is stored in a database (Oracle, MySQL, PostgreSQL, SQLite)
- Centralised configuration and storage of information
- and more...
Full documentation
A complete documentation is available as a PDF file here http://www.zabbix.com/documentation.php You'll also find some useful informations on the official wiki of the project and the forum.
Versions
The following is the information about the latest release of each component:
Requirements
- SME Server 7.X (9.X or higher for zabbix-server)
- php>=5.4 for zabbix server only, hence you will need to first install smeserver-php-scl on SME9 and set php54 or higher as default php version
Components
Zabbix is composed of four major components:
- The server (the main part). The server will store and analyse the different data, send alerts, etc...
- The web interface (which is automatically installed with the server with this contrib).
- The agent, which gathers informations on the different hosts you monitor.
- The proxy, which is an optional part, can be used to collect performance and availability data locally, and send it to the server.
Server
The server is the core component of Zabbix software. It uses one database (MySQL in this contrib) to store configuration, performance and integrity information. The server can check network services with simple check (ICMP, TCP etc...) for agent-less monitoring, it can monitor network devices using SNMP and is also the central component to which agent report information (agent can work in active, passive, or both mode). The server will also analyse all the information and send alerts depending on very flexible triggers.
Installation
yum install smeserver-extrarepositories-zabbix -y
db yum_repositories setprop zabbix44 status enabled
signal-event yum-modify
yum install smeserver-zabbix-server --enablerepo=smecontribs
the following version are available :
zabbix42 zabbix44 zabbix45 zabbix50 zabbix51 zabbix52 zabbix53
Zabbix is not provided as server obn Rhel 7 for version 4.5 and up. Thisis because of base php version, which could be worked around using php-fpm, but would also us to build it.
First enable the needed repo: Firewall service and REMI
db yum_repositories set fws repository \
BaseURL http://repo.firewall-services.com/centos/\$releasever \
EnableGroups no GPGCheck yes \
Name "Firewall Services" \
GPGKey http://repo.firewall-services.com/RPM-GPG-KEY \
Visible no status disabled
db yum_repositories set fws-testing repository \
BaseURL http://repo.firewall-services.com/centos-testing/\$releasever \
EnableGroups no GPGCheck yes \
Name "Firewall Services Testing" \
GPGKey http://repo.firewall-services.com/RPM-GPG-KEY \
Visible no status disabled
issue the following command on the SME Server shell:
/sbin/e-smith/db yum_repositories set remi-safe repository \
Name 'Remi - safe' \
BaseURL 'http://rpms.famillecollet.com/enterprise/$releasever/safe/$basearch/' \
EnableGroups no \
GPGCheck yes \
GPGKey http://rpms.famillecollet.com/RPM-GPG-KEY-remi \
Visible yes \
status enabled
signal-event yum-modify
to install Zabbix server, just use yum:
yum --enablerepo=smecontribs,fws,remi-safe install smeserver-zabbix-server --exclude=smeserver-zabbix-proxy
NB: the --exclude=smeserver-zabbix-proxy is due to a conflict in late 2019 on SME9 as FWS started using zabbix from zabbix repo instead of building it. We will fix this for SME10 in few months.
then go to your server-manager to set php5.4 or higher as default php for your SME, or you will not be able to access to zabbix web gui, or just issue the following
config setprop php54 PhpModule enabled   #replace here with php55 or php56 if you have other needs
signal-event php-update
then you will have to either tweak the default configuration as explain in next step or just issue :
signal-event zabbix-server-update
then go to your web interface : https://yourserveradress/zabbix
DB Parameters
Here's the list of available DB parameters for zabbix-server service on SME:
- AdminPassword: A random password is generated during the installation for Admin user. Replace the default weak zabbix password upon install.
- DbName: The name of the database where everything is stored. Default is 'zabbixdb'
- DbPassword: The password of the database. A random password is generated during the installation
- DbUser: The user name to access the database. Default is zabbixuser
- JabberAccount: Account used to send jabber notification
- JabberServer: Jabber server to use to send notifications
- JabberPassword: Password for the account (for "JabberAccount")
- JabberTLS: (enabled|disabled) Does your Jabber server requires TLS security
- NodeID: The node ID of your server. If you don't use distributed monitoring (just one central Zabbix server), you should let this to 0
- TCPPort: Port used for agent<->server (and proxy<->server) communication. The default is 10051
- TimeZone: It's very important for zabbix to know your time zone (PHP TimeZone setting). Unfortunately, SME do not set it. You can specify your time zone. This setting will only affect Zabbix
- WebAccess: (local|public|disabled) From where you'll be able to access the web interface. You can set it to disabled if you want to disable the web interface (for example, if your server is a node of a distributed environment)
- access: (public|local) From where zabbix port will be available (controlled by TCPPort). You should restrict the access to a list of host with the AllowHosts key if you set public here.
- status: Should the service be started automatically ?
Once you have everything configured like you want, just issue
signal-event zabbix-server-update
to expand the templates and restart the needed services.
Web Interface
The main web interface is available (if not disabled with the key WebAccess) on https://server.domain.tld/zabbix. The default user is Admin (with uppercase A as first letter), with strong password found in the config property AdminPasswd starting smeserver-zabbix-server 0.1-29. If you change it, it will not be overwritten on update. ( prior that the default was zabbix, in this case you should change this password ASAP)
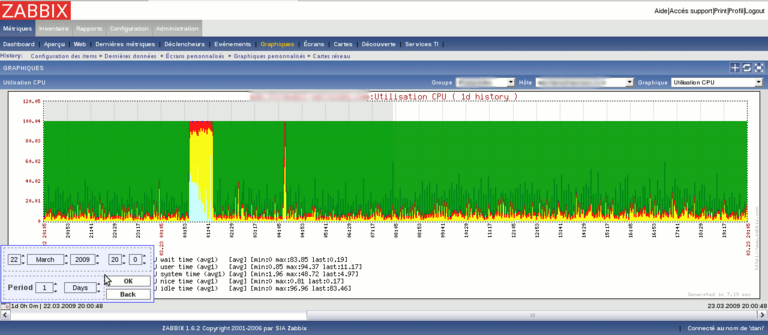
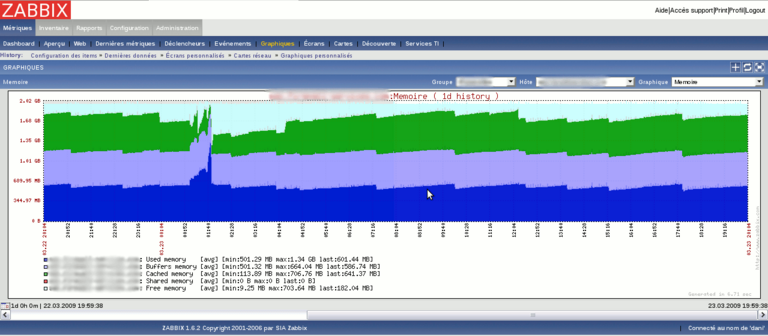
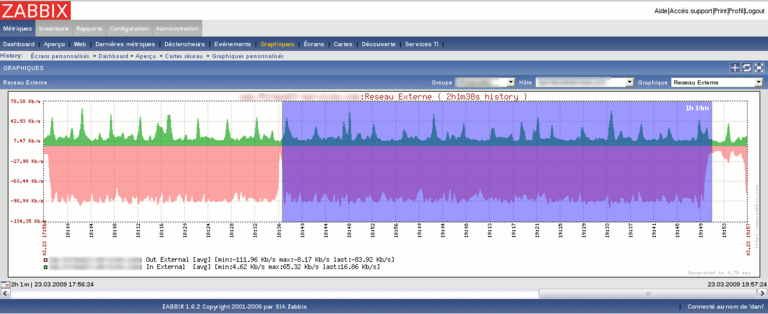
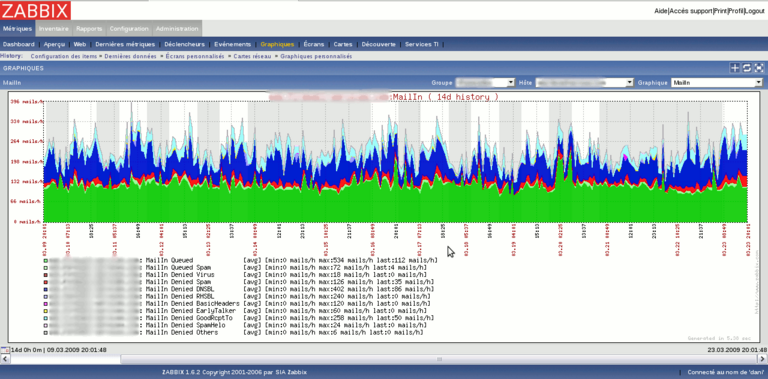
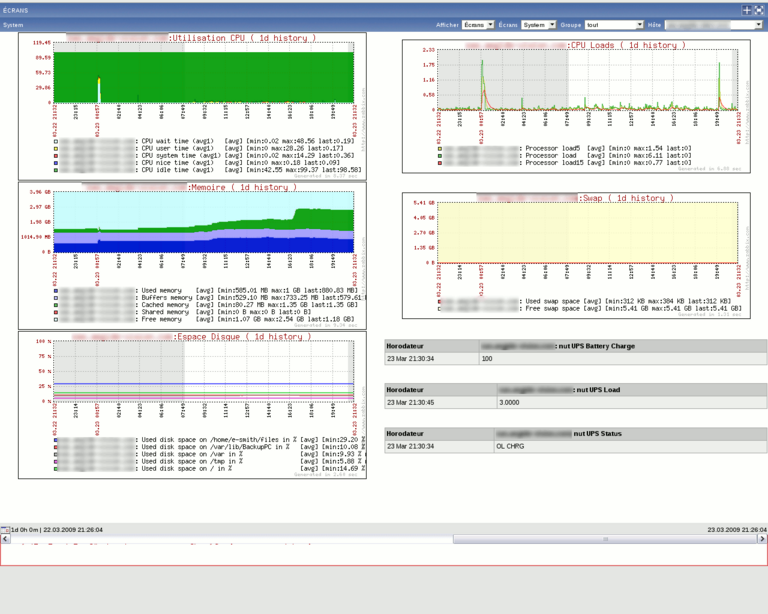
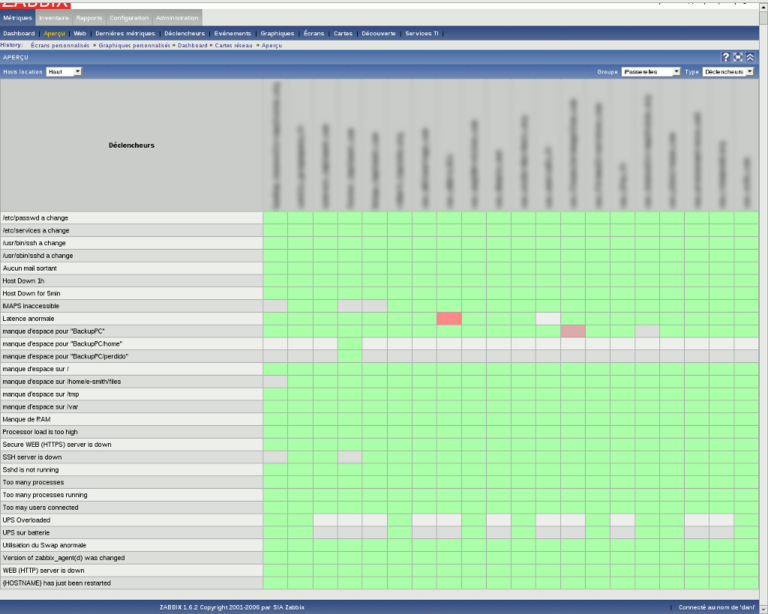
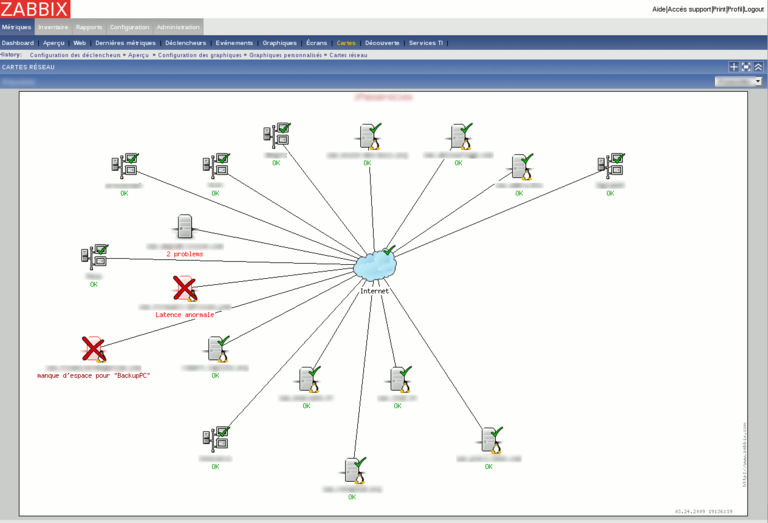
Here are some screenshots of what you can get with zabbix
For more screenshots, visit the project website here
Agent
see Zabbix-agent
Proxy
see Zabbix-proxy
Monitoring SME servers
If you want to monitor SME Servers with zabbix, you'll first need to install the agent as explained earlier, then configure the agent to accept connection from your server. For example, to monitor you local server (the one running zabbix-server):
db configuration setprop zabbix-agent Servers localhost active disabled passive enabled
signal-event zabbix-agent-update
Then, just add a host in Zabbix, pointing to localhost.
Now you can start adding items (type agent (active or passive depending on the mode you use on the agent)) to this new host.
If you want to monitor SME Servers on the Internet and use passive mode, the server will initiate connections to the agent. You'll need to port-forward the port if you run in serveronly mode (the default is port 10050 TCP), or to open this port in the firewall if runing in server&gateway mode:
db configuration setprop zabbix-agent Servers w.x.y.z active disabled passive enabled access public AllowHosts w.x.y.z
signal-event zabbix-agent-update
You can download here an archive with some XML exports of the templates I use to monitor my servers. Just extract the archive, and import the templates you want in Zabbix (using the Import/Export menu of zabbix configuration)
Each XML file represent a template in Zabbix
- Template_SME is the main template. It'll add a lot of items for global system monitoring, triggers if load is too high, lack of free memory, httpd is down, passwd has changed etc... and also some graphs like CPU usage, memory, disk space, network usage etc... This templates requires the Template_icmp and Template_app_MySQL template
- Template_SME_coovaChilli will add tun0 statistics (useful if you use CoovaChilli contrib). It'll also create a graph for tun0 stats
- Template_SME_softRaid will add items and triggers for software raid monitoring. If you link a SME Server with this template, you'll be warned if one of the raid array is degraded or rebuilding
- Template_SME_megaRaid will do the same but for MegaRaid based cards. It also requires the MegaCli utility from LSI website
- Template_SME_nutUPS: Will add items and triggers to be warned if your UPS is on battery, or overloaded.
- Template_icmp: will configure two items to check if the server is alive, and measure the latency. It also provides latency graphs and some triggers (if latency is too high, if host is down since more than 5min and if hosts is down for more than 1 hour)
Bugs
Please raise bugs under the SME-Contribs section in bugzilla and select the smeserver-zabbix component or use on of this link:
smeserver-zabbix-server
new bug for server
| ID | Product | Version | Status | Summary (5 tasks) ⇒ |
|---|---|---|---|---|
| 12282 | SME Contribs | 10.0 | CONFIRMED | Incorrect default charset for Zabbix database: "utf8mb4" instead "UTF8, UTF8MB3". |
| 12281 | SME Contribs | 10.0 | CONFIRMED | misisng font firectory in php base dir |
| 12279 | SME Contribs | 10.0 | CONFIRMED | missing deps |
| 11747 | SME Contribs | 10.0 | CONFIRMED | add SME specific templates |
| 11743 | SME Contribs | 10.0 | CONFIRMED | switch or at least configure ldap auth |
