Difference between revisions of "Nagios Grapher"
(New page: === Maintainer === Michael Weinberger === Introduction === The Nagios Grapher is a Nagios addon that collects performance data and represents these as graphs. [http://www.nagiosexcha...) |
(No difference)
|
Revision as of 22:41, 3 December 2007
Maintainer
Michael Weinberger
Introduction
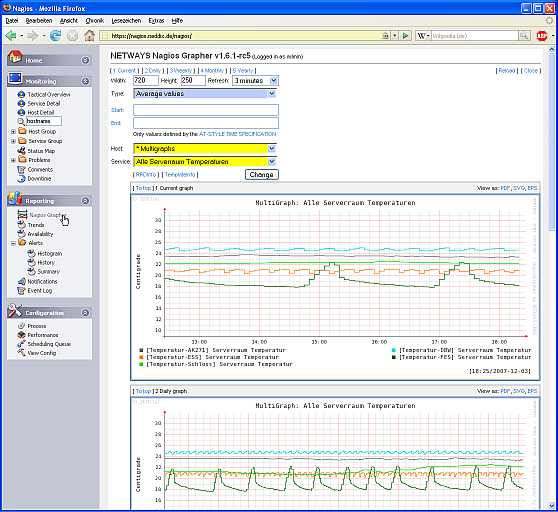
The Nagios Grapher is a Nagios addon that collects performance data and represents these as graphs. Read more...
This contrib installs the Netways Nagios Grapher v1.6.1-rc5 an requires Nagios installed, configured properly and running.
 |
NagiosGrapher serverroom temperatures graphic screenshot |
Download
Download the RPM from http://mirror.contribs.org/smeserver/contribs/michaelw/sme7/nagiosgrapher
Installation
Configure the dag repositoy
The following command will configure the dag repository on SME Server. EDIT NOT COMPLETE!
To create an entry in the database for the epel repository we open put the following commands in a terminal
window or in a shell window:
/sbin/e-smith/db yum_repositories set epel repository \
Name 'SME Server - epel' \
BaseURL 'http://<http://download.fedoraproject.org/pub/epel/7/$basearch' \
EnableGroups yes \
GPGCheck yes \
Visible no \
status disabled
To enable the changes:
signal-event yum-modify
Just to be sure, give yum a fresh start:
yum clean all
After adding it to the database we have to update the changes to the configuration file:
signal-event yum-modify
Installation of the Nagios Grapher package
/usr/bin/yum --enablerepo=dag localinstall smeserver-nagiosgrapher-*-0.noarch.rpm
Configuration
You need to edit serveral configuration files
in /etc/nagios/nagios.cfg add/modify
cfg_dir=/etc/nagios/serviceext
process_performance_data=1
service_perfdata_command=process-service-perfdata
in /etc/nagios/commands.cfg add/modify
define command {
  command_name   process-service-perfdata
  command_line   /usr/share/nagios/fifo_write.pl /var/log/nagios/rw/ngraph.pipe '$HOSTNAME$\t$SERVICEDESC$\t$SERVICEOUTPUT$\t$SERVICEPERFDATA$\n' 3
}
Create files in /etc/nagios/ngraph.d to configure the graphs. You may use the files in /etc/nagios/ngraph.d/samples/ as a starting point. Also consult the documentations in /usr/share/nagios/nagiosgrapher/doc/CONFIG and the links listed in the References section below.
This contribs has the file /etc/nagios/ngraph.d/cpuload.ncfg included which generates a graph for service definitons where the service descriptions contains the word "load". This works 'out of the box'.
Finally restart the services:
service nagiosgrapher restart
service nagiosgrapher restart
Uninstall
This removes the installed NagiosGrapher package.
/usr/bin/yum erase smeserver-nagiosgrapher
References
- Nagios Grapher homepage: http://www.nagiosexchange.org/NagiosGrapher.84.0.html
- Nagios Grapher download; http://www.nagiosexchange.org/Charts.42.0.html?&tx_netnagext_pi1%5Bp_view%5D=195
- Nagios Grapher mentioned a Nagios book: "Nagios : system and network monitoring / Wolfgang Barth / ISBN 1-59327-070-4", Chapter 17.5
- A German HowTo: http://www.nagios-wiki.de/doku.php/nagios/howtos/nagiosgrapher
- Nagios Grapher on netways.de http://www.netways.de/nc/de/produkte/nagios/integrationsloesungen/nagiosgrapher/?sword_list%5B%5D=nagiosgrapher